Good afternoon, yet another dreary day in the KC area. Temperatures have continued to fall off and there are some snow flurries and patches of brief light snows, especially on the MO side east of the KC metro. Skies will be clearing up a bit this afternoon from the NW>SE. The better accumulating snows will be well east of KC towards St Louis.
Forecast:
Tonight: Clearing to clear skies with bitterly cold wind chills of 5-15° below 0° and air temperatures dropping to about 4 °
Sunday: Cold with lows in the 5-10° range and highs near 18°. AM wind chills will be sub-zero. Winds will gradually slacken and switch towards the SW by evening. This is a sign that the cold air is departing. Temperatures Sunday evening will drop a bit then level out and start going up towards daybreak Monday.
Sunday night: A brief drop in the temperatures near 18° then a steady, if not warming temperature situation develops. Winds increasing out of the W/SW at 5-15 MPH
Monday: Milder, and breezy with partly cloudy skies and highs right back to near 40°
Discussion:
Pretty much all has gone according to plan. The colder air is here and is seeping southwards. Winds will be increasing a bit as the day moves along. There are some nice breaks in the clouds NW of the KC metro so I’m hopeful we’ll see a little sunshine out there before it sets after 5PM.
Notice on the 12PM surface map (temperatures are in RED) that the air is pretty darn chilly from here northwards…with temperatures near the I-80 corridor closer to 10°, if not some single digits.

Also notice how quickly this pretty darn cold air mass moves in and then moves out early Monday. Here are a series of maps showing the temperatures a few thousand feet off the ground (925 mb level). Starting at 6PM today and going through 6PM Monday…you can also see the next dump of cold air moving down from the northern Plains region.
6PM Sunday…
6AM Monday
6PM Monday…
maps above from NEXLAB
Basically all week long is an up/down thing. Our next chance of any decent accumulating snow will hold off till next weekend it appears. The only day I’m struggling with is Thursday. I’m not sure if we’re going to be well into the 40s or if another weak cold front will come through and knock us down somewhat.
Whatever “warmer days” we get should be enjoyed because overall it’s a cold look and with several Arctic shots coming…today & Tuesday and then some Canada cold next weekend…it’s overall a chilly look to the weather for the next 10+ days or so.
One of the reasons why we’re going to have an easier time sustaining some cold for a change is that the atmosphere is getting rather blocked in other parts of the hemisphere. This is unique to this particular winter and the lack of this blocking pattern developing has been one of the main reasons why we’re enjoyed a nice run of temperatures (mostly) since 11/1.
What do we mean by “blocking”. Typically we look for strong areas of higher pressure aloft to uncharacteristically become even stronger. This can also occur with strong areas of low pressure aloft. It can lead to a somewhat stagnant or “locked in” weather pattern. During the winter season this can lead to repeated cold shots of air over a certain amount of time. In the winter especially it’s a bit tougher to maintain a “locked in” pattern because the jetstream is considerably stronger than at any other time of the year but the “blocked” patterns have anecdotally a more dramatic effect on the weather on the ground.
There are various forms of “blocking” but I want to show you what we’re looking at this week and one of the best ways to show this is by going up to about 18,000′ or so and showing you the 500 mb pattern. Here is an explainer about what that level represents via NOAA
“The 500 mb surface is a constant pressure surface approximately midway up in the troposphere (the lowest layer of the earth’s atmosphere). The pressure exerted by the air column above this level is exactly 500 mb, but the altitude or height of this surface varies. The 500 mb constant pressure surface averages approximately 5600 m (18,000 plus ft) in height, but can vary from roughly 4700 m in an extremely cold (more dense) atmosphere near the poles to nearly 6000 m in a very warm (less dense) atmosphere near the equator. When mapping weather above the surface, constant pressure surfaces are preferred to constant height surfaces because the physics and math involved with the fluid dynamics of the atmosphere are better applied on constant pressure surfaces.”
The map projection takes a few seconds to get used to because I wanted to show you what was going on through the northern hemisphere…because what’s happening near and above the Arctic Circle is actually important for the weather in the US. This map is valid for Tuesday morning and shows that much of the Arctic region will be under ridges of higher pressure aloft. Since they are stronger than typical they are “blocking” the lower pressure regions (for example towards Hudsons Bay) from moving and actually allowing that region to drop southwards.
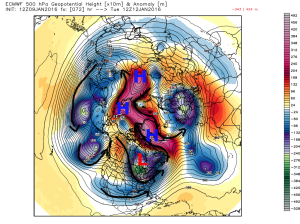
These areas of higher and lower pressures are connected to warmer and colder (relative to average) temperatures…notice how the Arctic region is warmer than average (significantly so) and as a result the cold air is dislodged southwards towards Canada and then the US (relative to average). The next map is the 850 mb map showing temperatures at around 5000 feet or so…
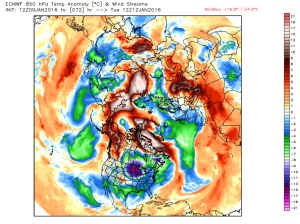
The reds/pinks/whites are milder air at that level and the greens/blues/purples are colder air relative to average at that level. Notice where the colder air is…and notice how much of the polar region is warmer than average.
In a nutshell when I see maps like what I see above…it’s a signal that the atmosphere is getting or is blocked up. Another way of looking at blocking patterns is by looking are various indices, two of which are called the NAO and the AO. They’re interesting to look at but in my opinion, some forecasters in the US put wayyyy to much emphasis on them. More on that in a minute.
What are these 2-3 letter abbreviations though. Well I’ve written about them dozens of times in the past. Let’s start with the NAO and I’ll be copy/pasting relevant information for your understanding…it’s thinking cap time for weather geeks!
The NAO has 2-3 phases really…positive, negative and neutral. You can see below what can happen in 2 of the 3 phases. Typically when positive, this signifies a lack of “blocking”. This means that typically cold air masses have a tougher time building and moving towards the US. The jetstream denoted by the dashed lines below isn’t as “buckled”. When negative the effects are opposite in many ways and the jetstream has a tendency to “buckle” more allowing farther south intrusions of colder air from the north

Here is the specific definition…from the UCAR web site…
NAO
What’s measured: atmospheric pressure
Timescale: a few weeks to many months
The North Atlantic Oscillation (NAO) plays a strong role in wintertime weather across eastern North America and Europe. Closely related to the Northern Annular Mode (NAM), it is typically measured through variations in the normal pattern of lower atmospheric pressure over Iceland and higher pressure near the Azores and Iberian Peninsula. Westerly winds are stronger when the NAO is positive and wetter, milder conditions predominate across northern Europe and the eastern United States. A negative NAO increases the odds for Arctic outbreaks of cold temperatures and snow in these areas.”
end text
Now we look at the NAO as a series of values…typically this is updated each day (sometimes several times per day based on the latest computer runs)…and each model will come out with various NAO forecasted numbers…for example here is the GFS model forecasted NAO…
Chart A)

Notice how we’ve been mostly positive since late September. There is a connection between those positive numbers and the lack of cold air masses moving towards the region this fall. This connection strengthens through and into the winter/early spring seasons.
In that forum, I wondered how LOW the NAO value has ever gotten during the winter months…and it appears to be around -2.7 or so in DEC of 2008. Just to prove though that you can’t ALWAYS connect a negative NAO to KC (local Midwest cold)…our ALL time record low in KC was back in DEC of 1989…on those dates and immediately and afterwards the NAO was positive. Now there was snow cover on the ground at the time, so that aspect helped provide the conditions needed to get really cold.
Basic rule of thumb…when the NAO goes DEEP into the negative, which is what it’s forecasted to do for the next 7-10 days or so, it’s easier for cold air to build and get released southwards. The maps above at 500 mbs are negative classic NAO patterns
Another index that we look at is called the AO or Arctic Oscillation. Again positive values trend milder in the US while negative values trend colder. These are by no means hard and fast rules/guidelines though. The graphic below is from NASA
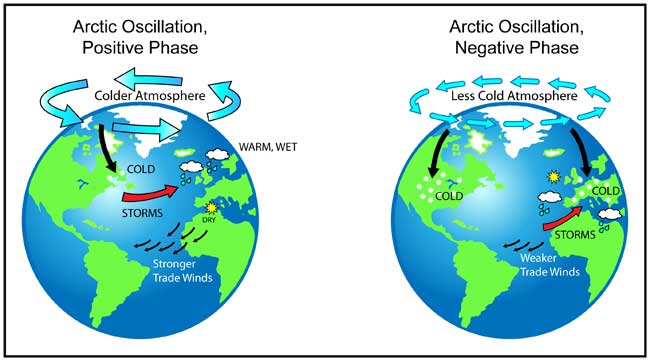
Chart B is the current and past AO values…again positive tends to be milder while negative tends to be colder

The AO is forecasted to stay VERY negative through the week into the next weekend before recovering. Interesting to note that some model data suggests the values will be near record lows later in the week. Values below -5 have only occurred about 80 times since 1950 and 20 times since 2000. Values below -6 have only occurred 8 times. Somewhat rarefied territory.
What’s interesting is that when the AO is this low in JAN…there is strong correlations to it being low again in FEB…this may be a predictor for what’s ahead next month…in terms of the cold…again negative numbers tends to be colder.
When both values work in conjunction with each other there are stronger correlations to getting the cold air to dump into the US…especially the central and eastern part of the country and this is what we’ll be seeing again later on next week, perhaps a bit more sustained than the 24-36 hour cold shots of air we’ve seen thus far.
I want to see the reality in how low these indices really end up getting. IF they get to record values I want to see what happens farther down the road, for example into the month of February and see if there are any correlations to our future weather.
Joe