KANSAS CITY, Mo. — Even though the 2012 election is over, the arguments over “red states” and “blue states” continue unabated. But if a new map showing the actual Democratic and Republican voter distribution across the nation is correct, then most states – even ones considered red or blue strongholds – might be more accurately described as purple.
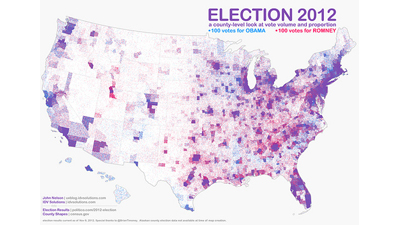
According to i09.com, datavizualization expert John Nelson has created a map that shows groups of 100 Mitt Romney and 100 Barack Obama voters as red or blue dots, broken down on a county-by-county basis. Higher-population areas with mixed voting are represented as purple.
Click here for the full-size map (WARNING: THIS IS A BIG HI-RES FILE)
Nelson says that traditional red/blue political maps are typically biased in favor of geographically large but population-light areas, and states tend to be represented as monolithic blocks of red and blue.
He says that his map gives a much clearer portrait of the nation’s varied electorate.
“(The map) is a pointillist look at the 2012 election results, which does a fairer job of illustrating where, how many, and how people voted in the election than the more typical full-color generalization,” Nelson told i09.
Nelson compiled the map from publicly-available election information.